Step 2
We will then use DIERS methodology to perform a two-phase test to determine if two-phase flow is likely based on an article by Harold Fisher and Harry S. Forrest, "Protection of Storage Tanks from Two-phase Flow Due to Fire Exposure".
Step 2-B
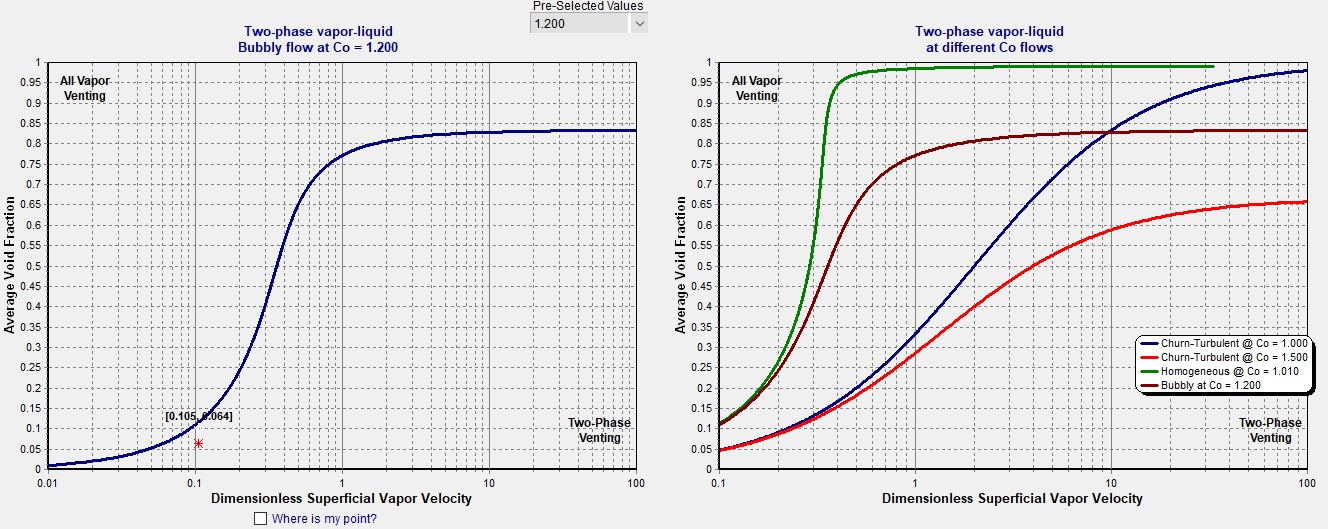
Below the user can view the results of the two-phase flow test within the alpha(α) vs Psi(Ψ) curve which plots the average void fraction, α (alpha) in the vessel against the dimensionless vapor velocity, Ψ (Psi). The user can view from the curve on the left where his design is located (red star), either above the curve for single phase venting or below the curve for two-phase venting. The design is clearly in the two-phase region.
The graph on the right shows various flow regime models using different correlation factors to compare how these curves compare to the actual flow regime model determined from the two-phase test. The two-phase test determines the flow regime to be bubbly. The correlating factor was randomly choosen
to be 1.2 (realistic), rather than 1.0 (conservative) or 1.5 (Unlikely but Possible). The user is able to change correlating factor or any other parameter to examine the effects of changes on predicting two-phase flow.